21 years later

The Independence Day celebration is a good opportunity to have a glance at the past 21 years to understand the economic processes and see where we are going to.
In 1991 there was a real economic revolution. The economic order was changed from administrative to market economy. This transition would be enough for the economy to be thrown into a shock situation even without any other factors. However, in Armenia there were many other factors that hit the economy from different sides. As a result of the collapse of the Soviet Union Armenia lost its markets and suppliers. The situation was even more complicated because of war, blockade, energetic crisis and other factors. The elder generations have seen everything and do not need additional descriptions, but in order to understand the entire picture, we have made up some statistics and numbers to illustrate the economic tendencies during the past years.
1. Economic growth and GDP volume
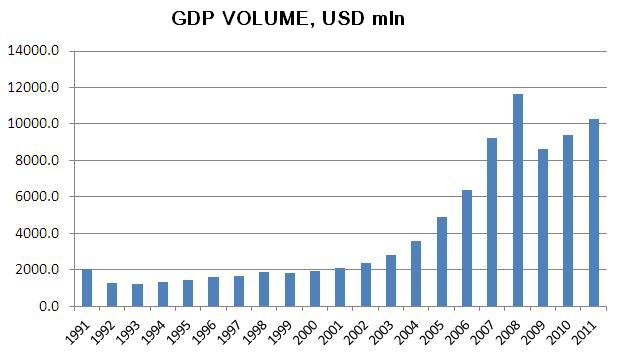
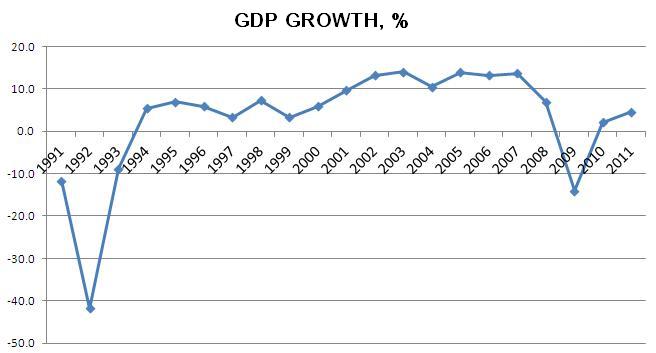
The World Bank compiles and publishes these indicators since 1991. In that year Armenia’s GDP dropped by 11.7%. The largest collapse of the GDP, however, was observed in 1992 – 41.8%. In 1994 the economy started recovering, and in 2002-2007 Armenia registered double-digit growth. This is the time when Armenia’s economy was called Caucasian Tiger, but the tiger in fact was not so impressive. The economy was sick because it relied mainly on the sectors of construction and mining production. This sickness, which means that the economy was not diversified, was felt during the crisis in 2009. During that year the economy could not resist the crisis and the GDP dropped by 14%. Currently economic development planned rate is 4%, but the president has instructed the government to do their best to provide 5-7% economic growth rate. Overall, in 1991-2011 Armenia’s GDP jumped by 10 times reaching $10.2 from 2 billion.
2. Consumer price indices or inflation
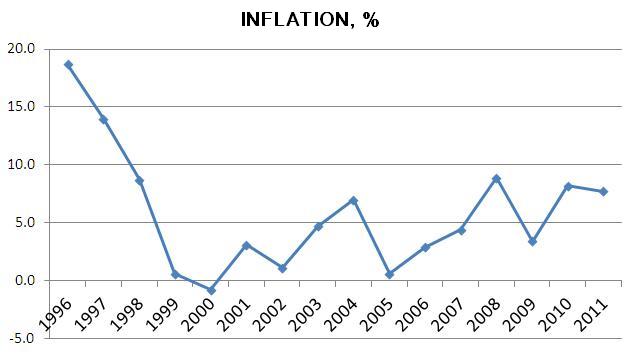
This is the most painful problem for a transition economy. There was time that the money lost its price not day by day, but hour by hour. For this reason we have made the chart starting from 1996, otherwise the disproportional statistics would mar the picture. According to the information of the Central Bank, in 1994 the inflation index was 4448%, which means that during that one year the prices of products jumped by 50 times compared to the previous year. One year later, in 1995 the inflation rate was higher by 2.7 times. At last in 1996 the government was able to resist the inflation at the level of 18.7%. Now the maximum permitted limit established by the budget is 5.5%.
3. Interest rates
We have separated this section on purpose because during those years any people were cheated being attracted by high interest rates as they invested in financial pyramids. There is no specific statistics about 1991-1994, but many people may remember being offered 300% interest rate. In 1995 the average interest rate offered by banks was 111.9%, and in 1996 – 66.4%. In parallel with stabilization of the financial sector the interest rates reduced as well, and now those are around 15-17%.
4. Emigration
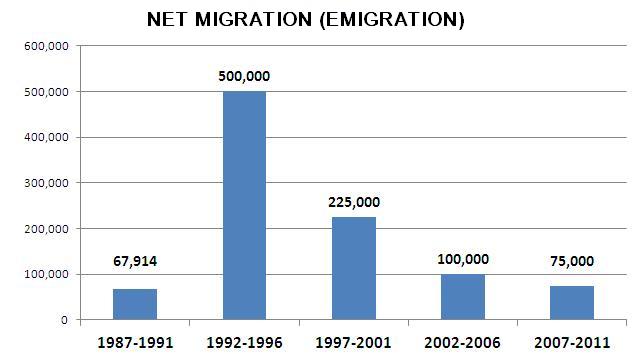
In addition to economic collapse there was demographic recession as well, and these two processes were closely connected. This is one of the most painful issues in Armenia. The World Bank has statistics for every five year period. The record in emigration growth was hit in 1992-1996 as during that time a half million people left from Armenia. Generally, in 1987-2011 overall approximately 970,000 people left from Armenia. Unfortunately emigration continues now too.
5. Birth rate
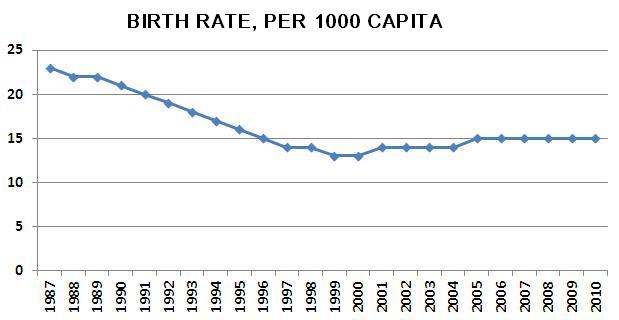
The chart illustrates the number of children born every year per 1000 capita. During these years this indicator is at the level of 15. These indicators show that during the war time there was a higher birth rate than during the years of double-digit economic growth or now. This means that the quality of growth was not good and also there is lack of support to natural growth and birth rate. For example, in 1987 this indicator was 23, after which it slowly declined to 13 in 1999-2000.
This 21-year period is not such a long time from the point of view of history. We hope that during the next anniversaries of independence these indicators will be better and higher.


